Spark it up a notch II
Nitty-gritty details on pyspark data-frames and more
Why am I writing this?
A lot of times while exploring datasets, we encounter tricky situations and eventually figure out how to write code for it, but more often than not, when we encounter it again, we tend to start from scratch. If only I had put in a dime for every such time, I could have easily retired by now. 😆 💲
Anyway, this is an attempt to have a one stop place to record all the different and commonly used transformations that can be done on a data-frame when exploring data. I hope you find it useful.
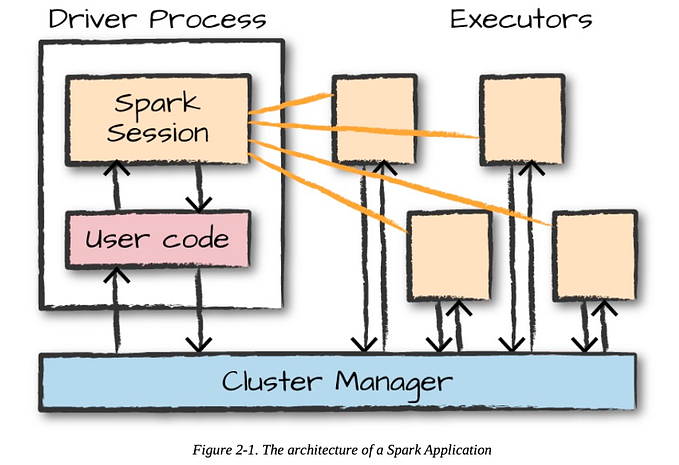
I had an introduction article with all the nitty-gritty details of Apache Spark- you can find that article here. I would highly encourage you to give it a read if you are a total newbie.
Who is this for?
This article is meant for someone who has some Python and querying experience. It is meant for someone who wants to get a head start on reading some data, viewing it, manipulating it and writing the result.
⚠️ DISCLAIMER ⚠️
I’m well aware that this is a really long article 😅 as it took me several days of continuous iterations to get it to where I wanted it to be. My intention of this article is to cover all sorts of use-cases that we need while exploring and analyzing large datasets. I have added a CONTENTS section that covers what is being explained, and each section and the corresponding examples is independent of the other sections. Essentially you can view only the section you are interested in and the example will cover everything without you having to read a precious section.
Contents
- Pyspark Quick Start
- Reading data into a pyspark data-frame
a. Reading data in Parquet
b. Reading data in CSV format
c. Reading data in JSON format - Writing data from a pyspark data-frame
- Viewing a data in a pyspark data-frame
- Manipulating pyspark dataframes
a. Concatenating values of multiple columns into a new column
b. Adding a constant value to the a new column in the data-frame
c. Adding a new column with values based on another column
d. Renaming a column
e. Dropping column(s), Dropping duplicate(s), Distinct rows
f. Use for filter() and where() - Window functions
a. Ranking functions
b. Analytical functions
c. Aggregate functions - Aggregates
- Joins & Unions
- Using a UDF
- RDD map
- Common mistake while trying to import an external package
- Conclusion
Pyspark quick start
Here is a quick way to install pyspark in your machine.
python3 -m pip install pysparkI would highly encourage you to explore it on an EMR cluster as a lot of things are taken care of for you. Once you have ssh-ed into your machine, you can type the following:
[hadoop@<ip-address>]$ pysparkPython 3.7.16 (default, Aug 30 2023, 20:37:53)
[GCC 7.3.1 20180712 (Red Hat 7.3.1-15)] on linux
Type "help", "copyright", "credits" or "license" for more information.
Setting default log level to "WARN".
23/10/16 18:30:11 WARN HiveConf: HiveConf of name hive.server2.thrift.url does not exist
23/10/16 18:30:14 WARN Client: Neither spark.yarn.jars nor spark.yarn.archive is set, falling back to uploading libraries under SPARK_HOME.
Welcome to
____ __
/ __/__ ___ _____/ /__
_\ \/ _ \/ _ `/ __/ '_/
/__ / .__/\_,_/_/ /_/\_\ version 2.4.7-amzn-1.1
/_/
Using Python version 3.7.16 (default, Aug 30 2023 20:37:53)
SparkSession available as 'spark'.You will see that the python version is 3.7.16 and Spark version 2.4.7. Now you are ready to explore your data 😈
Reading data into a pyspark data-frame
Reading data that is in CSV format
# Let us assume that we have a .csv file in an S3 location, which looks something like this:
# first_name;last_name;age;job
# Jane;Doe;30;Developer
# Amy;Bob;32;Manager
df = spark.read.option("delimiter", ";").csv("s3://<bucket-name>/<folder>/sample.csv")
df.show()
+----------+---------+---+---------+
|       _c0|      _c1|_c2|      _c3|
+----------+---------+---+---------+
|first_name|last_name|age|      job|
|      Jane|      Doe| 30|Developer|
|       Amy|      Bob| 32|  Manager|
+----------+---------+---+---------+

df.printSchema()
root
 |-- _c0: string (nullable = true)
 |-- _c1: string (nullable = true)
 |-- _c2: string (nullable = true)
 |-- _c3: string (nullable = true)
Couple of things to note here:
1. We are using
.option("delimiter",";")to explicitly mention the delimiter of the CSV. By default, it is,2. The name of the columns don’t seem to human-readable, and it looks like the first row of the dataframe is what should be the header. To mitigate this issue, we will use the
.option("header","true")while reading into the data-frame3. All of the columns have the same type (String). To mitigate this issue, we will use
.option("inferSchema","true")while reading into the data-frame
df = spark.read.option("header", "true").option("inferSchema","true").csv("s3://<bucket-name>/<folder>/sample.csv")
df.show()
+----------+---------+---+---------+
|first_name|last_name|age|      job|
+----------+---------+---+---------+
|      Jane|      Doe| 30|Developer|
|       Amy|      Bob| 32|  Manager|
+----------+---------+---+---------+

df.printSchema()
root
 |-- first_name: string (nullable = true)
 |-- last_name: string (nullable = true)
 |-- age: integer (nullable = true)
 |-- job: string (nullable = true)
As you can see, the column names make sense now, and the schema has been inferred appropriately.
(Note: age has been inferred as integer)
Reading data that is in Parquet format
Apache Parquet is a file format that is designed to support fast processing for complex data. Unlike CSV, AVRO, Apache Parquet is column oriented- which means the values of each table column are stored next to each other rather than the entire row. For ex.
Row based storage:
------------------
Jane|Doe|30|Developer
Amy |Bob|32|Manager

Column based storage:
--------------------
first_name: Jane|Amy
last_name: Doe|Bob
age:30|32
job:Developer|Manager
# Reading from a parquet file.
df = spark.read.parquet("s3://<bucket-name>/<folder>/sample.parquet")
df.show()
+----------+---------+---+---------+
|first_name|last_name|age| job|
+----------+---------+---+---------+
| Jane| Doe| 30|Developer|
| Amy| Bob| 32| Manager|
+----------+---------+---+---------+Another interesting thing is that if you are more comfortable with SQL and you want to use SQL querying to manipulate or transform the above data-frame, you can easily to that by doing the following:
df = spark.read.parquet("s3://<bucket-name>/<folder>/sample.parquet")
df.createOrReplaceTempView("parquetFile")
spark.sql("SELECT * FROM parquetFile WHERE age > 30").show()
+----------+---------+---+-------+
|first_name|last_name|age|    job|
+----------+---------+---+-------+
|       Amy|      Bob| 32|Manager|
+----------+---------+---+-------+
Reading data that is in JSON format
df = spark.read.parquet("s3://<bucket-name>/<folder>/sample.json")
df.show()
+----------+---------+---+---------+
|first_name|last_name|age|      job|
+----------+---------+---+---------+
|      Jane|      Doe| 30|Developer|
|       Amy|      Bob| 32|  Manager|
+----------+---------+---+---------+
Writing data from a pyspark data-frame
- Writing data into CSV format
df.write.option("header",True).csv("s3://<bucket-name>/<ouptut-folder>/")- Writing data into Parquet format
df.write.mode("append").parquet("s3://<bucket-name>/<ouptut-folder>/")Couple of things to note here:
- We need to use
mode("append")without which you will run into the error:
pyspark.sql.utils.AnalysisException: 'path s3://<bucket-name>/<ouptut-folder>/ already exists.;'The other modes are:
overwrite: The overwrite mode is used to overwrite the existing files/folderappend: To add the data to the existing files/folderignore: Ignores write operation when the files/folder already existserrorifexists/error: This is a default option when the files/folder already exists, it returns an error
When the data-frame is large and are we are trying to write the data-frame to a specific location, due to the parallelization of spark, multiple task nodes will start writing and hence we might see multiple part-*.parquet files being written. _SUCCESS file is used to indicate when all task nodes have completed writing the data
2023-10-16 21:48:48          0 _SUCCESS
2023-10-16 21:48:48       1092 part-00000-374d3e3b-0608-483e-a303-a78a30e050eb-c000.snappy.parquet
2023-10-16 21:48:48       1121 part-00001-374d3e3b-0608-483e-a303-a78a30e050eb-c000.snappy.parquet
Viewing data in a pyspark data-frame
.show(n=20, truncate=True, vertical=False) method is used to view data in a data-frame.
It takes in 3 parameters, all of which are optional.
1.n: int & optional
- by default shows up-to 20 rows.
2.truncate: bool/int &optional
- If set toTrue, truncate strings longer than 20 chars by default. If set to a number greater than one, truncates long strings to lengthtruncateand align cells right.
3.vertical: bool &optional
- If set toTrue, print output rows vertically (one line per column value).
df1.show()
+----------+---------+---+---------+--------------------+
|first_name|last_name|age|      job|                path|
+----------+---------+---+---------+--------------------+
|      Jane|      Doe| 30|Developer|Individial Contri...|
|       Amy|      Bob| 32|  Manager|          management|
+----------+---------+---+---------+--------------------+

df1.show(2,False)
+----------+---------+---+---------+----------------------+
|first_name|last_name|age|job      |path                  |
+----------+---------+---+---------+----------------------+
|Jane      |Doe      |30 |Developer|Individial Contributor|
|Amy       |Bob      |32 |Manager  |management            |
+----------+---------+---+---------+----------------------

df1.show(2,21)
+----------+---------+---+---------+---------------------+
|first_name|last_name|age|      job|                 path|
+----------+---------+---+---------+---------------------+
|      Jane|      Doe| 30|Developer|Individial Contrib...|
|       Amy|      Bob| 32|  Manager|           management|
+----------+---------+---+---------+---------------------+

df1.show(2,False,True)
-RECORD 0----------------------------
 first_name | Jane
 last_name  | Doe
 age        | 30
 job        | Developer
 path       | Individial Contributor
-RECORD 1----------------------------
 first_name | Amy
 last_name  | Bob
 age        | 32
 job        | Manager
 path       | management
If you want to view only a few columns, you can do that by using select
df.select("first_name","last_name").show()
+----------+---------+
|first_name|last_name|
+----------+---------+
|      Jane|      Doe|
|       Amy|      Bob|
+----------+---------+
Manipulating pyspark data-frames
Now that we have understood how to read, write and view data-frames, let’s come to the meat of the matter: Manipulation 😈😈
Concatenating values of multiple columns into a new column
- pyspark.sql.functions provides two functions:
concat()andconcat_ws()to perform the function of concatenating multiple columns into a single column in a data-frame. - The difference between concat() and concat_ws() is as follows:
- concat() function is used to concatenate multiple DataFrame columns into a single column.
- concat_ws() is used to concatenate multiple string columns into a single column with a given separator or delimiter - Ex:
from pyspark.sql.functions import concat
df.show()
+----------+---------+---+---------+
|first_name|last_name|age|      job|
+----------+---------+---+---------+
|      Jane|      Doe| 30|Developer|
|       Amy|      Bob| 32|  Manager|
+----------+---------+---+---------+

df.select(concat(df.first_name,df.last_name).alias("full_name"),df.age,df.job).show()
+---------+---+---------+
|full_name|age|      job|
+---------+---+---------+
|  JaneDoe| 30|Developer|
|   AmyBob| 32|  Manager|
+---------+---+---------+
from pyspark.sql.functions import concat_ws
df.show()
+----------+---------+---+---------+
|first_name|last_name|age| job|
+----------+---------+---+---------+
| Jane| Doe| 30|Developer|
| Amy| Bob| 32| Manager|
+----------+---------+---+---------+
df.select(concat_ws("-",df.first_name,df.last_name).alias("full_name"),df.age,df.job).show()
+---------+---+---------+
|full_name|age| job|
+---------+---+---------+
| Jane-Doe| 30|Developer|
| Amy-Bob| 32| Manager|
+---------+---+---------+Adding a constant value to the a new column in the data-frame
lit() function takes a constant value you wanted to add and returns a Column type, if you wanted to add a NULL/None use lit(None). In the example below, we add a literal constant value ‘Engineering’ to the DataFrame
from pyspark.sql.functions import lit

df.show()
+----------+---------+---+---------+
|first_name|last_name|age|      job|
+----------+---------+---+---------+
|      Jane|      Doe| 30|Developer|
|       Amy|      Bob| 32|  Manager|
+----------+---------+---+---------+

df.withColumn("Division",lit("Engineering")).show()
+----------+---------+---+---------+-----------+
|first_name|last_name|age|      job|   Division|
+----------+---------+---+---------+-----------+
|      Jane|      Doe| 30|Developer|Engineering|
|       Amy|      Bob| 32|  Manager|Engineering|
+----------+---------+---+---------+-----------+
Adding a new column with values based on another column
from pyspark.sql.functions import when
df.show()
+----------+---------+---+---------+
|first_name|last_name|age|      job|
+----------+---------+---+---------+
|      Jane|      Doe| 30|Developer|
|       Amy|      Bob| 32|  Manager|
+----------+---------+---+---------+

df.withColumn("Path",when((df.job=="Developer"), lit("Individial Contributor")).when((df.job=="Manager"),lit("Management")).otherwise(lit("-"))).show(2,False)
+----------+---------+---+---------+----------------------+
|first_name|last_name|age|job      |ath                  |
+----------+---------+---+---------+----------------------+
|Jane      |Doe      |30 |Developer|Individial Contributor|
|Amy       |Bob      |32 |Manager  |Management            |
+----------+---------+---+---------+----------------------+
Renaming a column
There are different ways of renaming columns in a dataframe.
- Renaming Columns Using
withColumnRenamed
df.show()
+----------+---------+---+---------+
|first_name|last_name|age|      job|
+----------+---------+---+---------+
|      Jane|      Doe| 30|Developer|
|       Amy|      Bob| 32|  Manager|
+----------+---------+---+---------+


# Renaming 1 column
df.withColumnRenamed("job","job_title").show(2,False)
+----------+---------+---+---------+
|first_name|last_name|age|job_title|
+----------+---------+---+---------+
|Jane      |Doe      |30 |Developer|
|Amy       |Bob      |32 |Manager  |
+----------+---------+---+---------+

# Renaming multiple columns
df.withColumnRenamed("job","jobTitle").withColumnRenamed("first_name","firstName").withColumnRenamed("last_name","lastName").show(2,False)
+---------+--------+---+---------+
|firstName|lastName|age|jobTitle |
+---------+--------+---+---------+
|Jane     |Doe     |30 |Developer|
|Amy      |Bob     |32 |Manager  |
+---------+--------+---+---------+- Renaming columns using
selectandalias
from pyspark.sql.functions import col
df.show()
+----------+---------+---+---------+
|first_name|last_name|age|      job|
+----------+---------+---+---------+
|      Jane|      Doe| 30|Developer|
|       Amy|      Bob| 32|  Manager|
+----------+---------+---+---------+

df.select(col("first_name").alias("user_fname"),col("last_name").alias("user_lname"),col("age").alias("user_age")).show()
+----------+----------+--------+
|user_fname|user_lname|user_age|
+----------+----------+--------+
|      Jane|       Doe|      30|
|       Amy|       Bob|      32|
+----------+----------+--------+- Using the .toDF()
Returns a new DataFrame with new specified column names. It is used on an RDD to convert it from RDD to a data-frame.
df.show()
+----------+---------+---+---------+
|first_name|last_name|age|      job|
+----------+---------+---+---------+
|      Jane|      Doe| 30|Developer|
|       Amy|      Bob| 32|  Manager|
+----------+---------+---+---------+

df.toDF("user_fname","user_lname","user_age","user_job").show()
+----------+----------+--------+---------+
|user_fname|user_lname|user_age| user_job|
+----------+----------+--------+---------+
|      Jane|       Doe|      30|Developer|
|       Amy|       Bob|      32|  Manager|
+----------+----------+--------+---------+
Dropping column(s), Dropping duplicate(s), Distinct rows
- distinct() — This function is used to drop or remove all the duplicates from a data-frame.
- dropDuplicates() — This function is used to drop rows based on selected(one or many) columns.
data = [("Jane", "Doe", 30,"Developer"), \
     ("Amy", "Bob", 32,"Manager"), \
     ("James", "Apple", 42,"Architect"), \
     ("Robert", "Tan", 38,"Developer"), \
     ("Scott", "Cook", 45,"Architect"), \
     ("Jen", "Smith", 34,"Manager"), \
     ("Kumar", "Miller", 35,"HR"), \
     ("Jane", "Doe", 30,"Developer"), \
     ("Saif", "Wilson", 40,"Manager") \
   ]
columns= ["user_fname", "user_lname","age", "job"]
df = spark.createDataFrame(data = data, schema = columns)
df.printSchema()
df.show()

## As you can see, "Jane Doe" row is repeated twice.
+----------+----------+---+---------+
|user_fname|user_lname|age|      job|
+----------+----------+---+---------+
|      Jane|       Doe| 30|Developer|
|       Amy|       Bob| 32|  Manager|
|     James|     Apple| 42|Architect|
|    Robert|       Tan| 38|Developer|
|     Scott|      Cook| 45|Architect|
|       Jen|     Smith| 34|  Manager|
|     Kumar|    Miller| 35|       HR|
|      Jane|       Doe| 30|Developer|
|      Saif|    Wilson| 40|  Manager|
+----------+----------+---+---------+

## In the following case, both distinct() and  drop_duplicates() behave the same
df.count()
9
df.distinct().count()
8
df.drop_duplicates().count()
8

## This shows that we are dropping all repeating jobs and have only the first occurrence of each of the jobs
df.drop_duplicates(["job"]).count()
4
df.drop_duplicates(["job"]).show()
+----------+----------+---+---------+
|user_fname|user_lname|age|      job|
+----------+----------+---+---------+
|     James|     Apple| 42|Architect|
|       Amy|       Bob| 32|  Manager|
|     Kumar|    Miller| 35|       HR|
|      Jane|       Doe| 30|Developer|
+----------+----------+---+---------+
Use for filter() and where()
filter() and where() are essentially used for filtering out results. They effectively do the same thing; where() is typically used if you are more comfortable with SQL like querying.
#################### USING FILTER ####################
df.filter(df.gender=="F").show()
+----------+----------+---+---------+------+
|user_fname|user_lname|age|      job|gender|
+----------+----------+---+---------+------+
|      Jane|       Doe| 30|Developer|     F|
|       Amy|       Bob| 32|  Manager|     F|
|    Kumari|    Miller| 35|       HR|     F|
|      Jane|       Doe| 30|Developer|     F|
+----------+----------+---+---------+------+

from pyspark.sql.functions import col
df.filter(col("gender")=="F").show()
+----------+----------+---+---------+------+
|user_fname|user_lname|age|      job|gender|
+----------+----------+---+---------+------+
|      Jane|       Doe| 30|Developer|     F|
|       Amy|       Bob| 32|  Manager|     F|
|    Kumari|    Miller| 35|       HR|     F|
|      Jane|       Doe| 30|Developer|     F|
+----------+----------+---+---------+------+

#### USING isin() ####
df.filter(df.job.isin(["Developer","Manager"])).show()
+----------+----------+---+---------+------+
|user_fname|user_lname|age|      job|gender|
+----------+----------+---+---------+------+
|      Jane|       Doe| 30|Developer|     F|
|       Amy|       Bob| 32|  Manager|     F|
|    Robert|       Tan| 38|Developer|     M|
|       Jen|     Smith| 34|  Manager|     M|
|      Jane|       Doe| 30|Developer|     F|
|      Saif|    Wilson| 40|  Manager|     M|
+----------+----------+---+---------+------+
#### USING OR(|) ####
df.filter((df.job=="Developer") | (df.job=="Manager")).show()
+----------+----------+---+---------+------+
|user_fname|user_lname|age|      job|gender|
+----------+----------+---+---------+------+
|      Jane|       Doe| 30|Developer|     F|
|       Amy|       Bob| 32|  Manager|     F|
|    Robert|       Tan| 38|Developer|     M|
|       Jen|     Smith| 34|  Manager|     M|
|      Jane|       Doe| 30|Developer|     F|
|      Saif|    Wilson| 40|  Manager|     M|
+----------+----------+---+---------+------+

#################### USING WHERE ####################
df.where(df.gender=="F").show()
+----------+----------+---+---------+------+
|user_fname|user_lname|age|      job|gender|
+----------+----------+---+---------+------+
|      Jane|       Doe| 30|Developer|     F|
|       Amy|       Bob| 32|  Manager|     F|
|    Kumari|    Miller| 35|       HR|     F|
|      Jane|       Doe| 30|Developer|     F|
+----------+----------+---+---------+------+

from pyspark.sql.functions import col
df.where(col("gender")=="F").show()
+----------+----------+---+---------+------+
|user_fname|user_lname|age|      job|gender|
+----------+----------+---+---------+------+
|      Jane|       Doe| 30|Developer|     F|
|       Amy|       Bob| 32|  Manager|     F|
|    Kumari|    Miller| 35|       HR|     F|
|      Jane|       Doe| 30|Developer|     F|
+----------+----------+---+---------+------+

df.where(df.job.isin(["Developer"])).show()
+----------+----------+---+---------+------+
|user_fname|user_lname|age|      job|gender|
+----------+----------+---+---------+------+
|      Jane|       Doe| 30|Developer|     F|
|    Robert|       Tan| 38|Developer|     M|
|      Jane|       Doe| 30|Developer|     F|
+----------+----------+---+---------+------+
Two small things to note here:
— If you referring to a specific column, that can be done in two ways.
1. Using the data-frame :df.gender
2. Or using the function col() :col(“gender”).isin()is a function that is commonly used when filtering out more than 1 value.— Of-course you can create a filter/where using OR/AND and all of that, but this is just syntactically more pleasing, IMO :D
Window functions
Window functions operate on a specific set of rows (like frame/partition) and return a single value for every input row. PySpark SQL supports three different kinds of window functions with some useful/commonly used functions under each:
- Ranking functions
- row_number()
- rank()
- dense_rank()
- percent_rank()
- ntile() - Analytical functions
- cume_dist()
- lag()
- lead() - Aggregate functions
- avg
- sum
- min
- max
Ranking functions
Example for row_number():
from pyspark.sql.window import Window
from pyspark.sql.functions import row_number,col
from pyspark.sql.functions import dense_rank,rank

data = [("Jane", "Doe", 30,"Developer"), \
     ("Amy", "Bob", 32,"Manager"), \
     ("James", "Apple", 42,"Architect"), \
     ("Robert", "Tan", 38,"Developer"), \
     ("Scott", "Cook", 45,"Architect"), \
     ("Jen", "Smith", 34,"Manager"), \
     ("Jenny", "Khan", 34,"Manager"), \
     ("Kenny", "Sebastian", 34,"Manager"), \
     ("Kumar", "Miller", 35,"HR"), \
     ("Jane", "Doe", 30,"Developer"), \
     ("Saif", "Wilson", 40,"Manager") \
   ]
columns= ["user_fname", "user_lname","age", "job"]
df = spark.createDataFrame(data = data, schema = columns)
df.printSchema()
df.show()
+----------+----------+---+---------+
|user_fname|user_lname|age|      job|
+----------+----------+---+---------+
|      Jane|       Doe| 30|Developer|
|       Amy|       Bob| 32|  Manager|
|     James|     Apple| 42|Architect|
|    Robert|       Tan| 38|Developer|
|     Scott|      Cook| 45|Architect|
|       Jen|     Smith| 34|  Manager|
|     Jenny|      Khan| 34|  Manager|
|     Kenny| Sebastian| 34|  Manager|
|     Kumar|    Miller| 35|       HR|
|      Jane|       Doe| 30|Developer|
|      Saif|    Wilson| 40|  Manager|
+----------+----------+---+---------+


windowSpec  = Window.partitionBy("job").orderBy(col("age").desc())
df.withColumn("row_number",row_number().over(windowSpec)).show(truncate=False)
+----------+----------+---+---------+----------+
|user_fname|user_lname|age|job      |row_number|
+----------+----------+---+---------+----------+
|Scott     |Cook      |45 |Architect|1         |
|James     |Apple     |42 |Architect|2         |
|Saif      |Wilson    |40 |Manager  |1         |
|Jen       |Smith     |34 |Manager  |2         |
|Jenny     |Khan      |34 |Manager  |3         |
|Kenny     |Sebastian |34 |Manager  |4         |
|Amy       |Bob       |32 |Manager  |5         |
|Kumar     |Miller    |35 |HR       |1         |
|Robert    |Tan       |38 |Developer|1         |
|Jane      |Doe       |30 |Developer|2         |
|Jane      |Doe       |30 |Developer|3         |
+----------+----------+---+---------+----------+

## Using row_number() - we can calculate the oldest person by department
df.withColumn("row_number",row_number().over(windowSpec)).filter("row_number == 1").show(truncate=False)
+----------+----------+---+---------+----------+
|user_fname|user_lname|age|job      |row_number|
+----------+----------+---+---------+----------+
|Scott     |Cook      |45 |Architect|1         |
|Saif      |Wilson    |40 |Manager  |1         |
|Kumar     |Miller    |35 |HR       |1         |
|Robert    |Tan       |38 |Developer|1         |
+----------+----------+---+---------+----------+
Example for rank():
from pyspark.sql.window import Window
from pyspark.sql.functions import rank

data = [("Jane", "Doe", 30,"Developer"), \
     ("Amy", "Bob", 32,"Manager"), \
     ("James", "Apple", 42,"Architect"), \
     ("Robert", "Tan", 38,"Developer"), \
     ("Scott", "Cook", 45,"Architect"), \
     ("Jen", "Smith", 34,"Manager"), \
     ("Jenny", "Khan", 34,"Manager"), \
     ("Kenny", "Sebastian", 34,"Manager"), \
     ("Kumar", "Miller", 35,"HR"), \
     ("Jane", "Doe", 30,"Developer"), \
     ("Saif", "Wilson", 40,"Manager") \
   ]
columns= ["user_fname", "user_lname","age", "job"]
df = spark.createDataFrame(data = data, schema = columns)
df.printSchema()
df.show()
+----------+----------+---+---------+
|user_fname|user_lname|age|      job|
+----------+----------+---+---------+
|      Jane|       Doe| 30|Developer|
|       Amy|       Bob| 32|  Manager|
|     James|     Apple| 42|Architect|
|    Robert|       Tan| 38|Developer|
|     Scott|      Cook| 45|Architect|
|       Jen|     Smith| 34|  Manager|
|     Jenny|      Khan| 34|  Manager|
|     Kenny| Sebastian| 34|  Manager|
|     Kumar|    Miller| 35|       HR|
|      Jane|       Doe| 30|Developer|
|      Saif|    Wilson| 40|  Manager|
+----------+----------+---+---------+

windowSpec  = Window.partitionBy("job").orderBy(col("age").desc())
## Using rank() - we can calculate the oldest person by department
df.withColumn("rank",rank().over(windowSpec)).show()
+----------+----------+---+---------+----+
|user_fname|user_lname|age|      job|rank|
+----------+----------+---+---------+----+
|     Scott|      Cook| 45|Architect|   1|
|     James|     Apple| 42|Architect|   2|
|      Saif|    Wilson| 40|  Manager|   1|
|       Jen|     Smith| 34|  Manager|   2|
|     Jenny|      Khan| 34|  Manager|   2|
|     Kenny| Sebastian| 34|  Manager|   2|
|       Amy|       Bob| 32|  Manager|   5|
|     Kumar|    Miller| 35|       HR|   1|
|    Robert|       Tan| 38|Developer|   1|
|      Jane|       Doe| 30|Developer|   2|
|      Jane|       Doe| 30|Developer|   2|
+----------+----------+---+---------+----+
df.withColumn("rank",rank().over(windowSpec)).filter("rank == 1").show()
+----------+----------+---+---------+----+
|user_fname|user_lname|age|      job|rank|
+----------+----------+---+---------+----+
|     Scott|      Cook| 45|Architect|   1|
|      Saif|    Wilson| 40|  Manager|   1|
|     Kumar|    Miller| 35|       HR|   1|
|    Robert|       Tan| 38|Developer|   1|
+----------+----------+---+---------+----+
One of thing to note here:
If you observe the job
Manager, rank() leaves gaps in rank when there are ties.
+----------+----------+---+---------+----+
|user_fname|user_lname|age|      job|rank|
+----------+----------+---+---------+----+
|      Saif|    Wilson| 40|  Manager|   1|
|       Jen|     Smith| 34|  Manager|   2|
|     Jenny|      Khan| 34|  Manager|   2|
|     Kenny| Sebastian| 34|  Manager|   2|
|       Amy|       Bob| 32|  Manager|   5|
+----------+----------+---+---------+----+
Example for dense_rank():
from pyspark.sql.window import Window
from pyspark.sql.functions import dense_rank

data = [("Jane", "Doe", 30,"Developer"), \
     ("Amy", "Bob", 32,"Manager"), \
     ("James", "Apple", 42,"Architect"), \
     ("Robert", "Tan", 38,"Developer"), \
     ("Scott", "Cook", 45,"Architect"), \
     ("Jen", "Smith", 34,"Manager"), \
     ("Jenny", "Khan", 34,"Manager"), \
     ("Kenny", "Sebastian", 34,"Manager"), \
     ("Kumar", "Miller", 35,"HR"), \
     ("Jane", "Doe", 30,"Developer"), \
     ("Saif", "Wilson", 40,"Manager") \
   ]
columns= ["user_fname", "user_lname","age", "job"]
df = spark.createDataFrame(data = data, schema = columns)
df.printSchema()
df.show()
+----------+----------+---+---------+
|user_fname|user_lname|age|      job|
+----------+----------+---+---------+
|      Jane|       Doe| 30|Developer|
|       Amy|       Bob| 32|  Manager|
|     James|     Apple| 42|Architect|
|    Robert|       Tan| 38|Developer|
|     Scott|      Cook| 45|Architect|
|       Jen|     Smith| 34|  Manager|
|     Jenny|      Khan| 34|  Manager|
|     Kenny| Sebastian| 34|  Manager|
|     Kumar|    Miller| 35|       HR|
|      Jane|       Doe| 30|Developer|
|      Saif|    Wilson| 40|  Manager|
+----------+----------+---+---------+

windowSpec  = Window.partitionBy("job").orderBy(col("age").desc())
df.withColumn("dense_rank",dense_rank().over(windowSpec)).show()
+----------+----------+---+---------+----------+
|user_fname|user_lname|age|      job|dense_rank|
+----------+----------+---+---------+----------+
|     Scott|      Cook| 45|Architect|         1|
|     James|     Apple| 42|Architect|         2|
|      Saif|    Wilson| 40|  Manager|         1|
|       Jen|     Smith| 34|  Manager|         2|
|     Jenny|      Khan| 34|  Manager|         2|
|     Kenny| Sebastian| 34|  Manager|         2|
|       Amy|       Bob| 32|  Manager|         3|
|     Kumar|    Miller| 35|       HR|         1|
|    Robert|       Tan| 38|Developer|         1|
|      Jane|       Doe| 30|Developer|         2|
|      Jane|       Doe| 30|Developer|         2|
+----------+----------+---+---------+----------+
One of thing to note here:
If you observe the job
Manager, dense_rank() DOES NOT leave gaps in rank when there are ties.
+----------+----------+---+---------+----------+
|user_fname|user_lname|age|      job|dense_rank|
+----------+----------+---+---------+----------+
|      Saif|    Wilson| 40|  Manager|         1|
|       Jen|     Smith| 34|  Manager|         2|
|     Jenny|      Khan| 34|  Manager|         2|
|     Kenny| Sebastian| 34|  Manager|         2|
|       Amy|       Bob| 32|  Manager|         3|
+----------+----------+---+---------+----------+
Example for percent_rank():
from pyspark.sql.functions import percent_rank
from pyspark.sql.window import Window
from pyspark.sql.functions import dense_rank

data = [("Jane", "Doe", 30,"Developer"), \
     ("Amy", "Bob", 32,"Manager"), \
     ("James", "Apple", 42,"Architect"), \
     ("Robert", "Tan", 38,"Developer"), \
     ("Scott", "Cook", 45,"Architect"), \
     ("Jen", "Smith", 34,"Manager"), \
     ("Jenny", "Khan", 34,"Manager"), \
     ("Kenny", "Sebastian", 34,"Manager"), \
     ("Kumar", "Miller", 35,"HR"), \
     ("Jane", "Doe", 30,"Developer"), \
     ("Saif", "Wilson", 40,"Manager") \
   ]
columns= ["user_fname", "user_lname","age", "job"]
df = spark.createDataFrame(data = data, schema = columns)
df.printSchema()
df.show()

+----------+----------+---+---------+
|user_fname|user_lname|age|      job|
+----------+----------+---+---------+
|      Jane|       Doe| 30|Developer|
|       Amy|       Bob| 32|  Manager|
|     James|     Apple| 42|Architect|
|    Robert|       Tan| 38|Developer|
|     Scott|      Cook| 45|Architect|
|       Jen|     Smith| 34|  Manager|
|     Jenny|      Khan| 34|  Manager|
|     Kenny| Sebastian| 34|  Manager|
|     Kumar|    Miller| 35|       HR|
|      Jane|       Doe| 30|Developer|
|      Saif|    Wilson| 40|  Manager|
+----------+----------+---+---------+

windowSpec  = Window.partitionBy("job").orderBy(col("age").desc())
df.withColumn("percent_rank",percent_rank().over(windowSpec)).show()
+----------+----------+---+---------+------------+
|user_fname|user_lname|age|      job|percent_rank|
+----------+----------+---+---------+------------+
|     Scott|      Cook| 45|Architect|         0.0|
|     James|     Apple| 42|Architect|         1.0|
|      Saif|    Wilson| 40|  Manager|         0.0|
|       Jen|     Smith| 34|  Manager|        0.25|
|     Jenny|      Khan| 34|  Manager|        0.25|
|     Kenny| Sebastian| 34|  Manager|        0.25|
|       Amy|       Bob| 32|  Manager|         1.0|
|     Kumar|    Miller| 35|       HR|         0.0|
|    Robert|       Tan| 38|Developer|         0.0|
|      Jane|       Doe| 30|Developer|         0.5|
|      Jane|       Doe| 30|Developer|         0.5|
+----------+----------+---+---------+------------+
Example for ntile():
from pyspark.sql.functions import percent_rank
from pyspark.sql.window import Window
from pyspark.sql.functions import dense_rank

data = [("Jane", "Doe", 30,"Developer"), \
     ("Amy", "Bob", 32,"Manager"), \
     ("James", "Apple", 42,"Architect"), \
     ("Robert", "Tan", 38,"Developer"), \
     ("Scott", "Cook", 45,"Architect"), \
     ("Jen", "Smith", 34,"Manager"), \
     ("Jenny", "Khan", 34,"Manager"), \
     ("Kenny", "Sebastian", 34,"Manager"), \
     ("Kumar", "Miller", 35,"HR"), \
     ("Jane", "Doe", 30,"Developer"), \
     ("Saif", "Wilson", 40,"Manager") \
   ]
columns= ["user_fname", "user_lname","age", "job"]
df = spark.createDataFrame(data = data, schema = columns)
df.printSchema()
df.show()

+----------+----------+---+---------+
|user_fname|user_lname|age|      job|
+----------+----------+---+---------+
|      Jane|       Doe| 30|Developer|
|       Amy|       Bob| 32|  Manager|
|     James|     Apple| 42|Architect|
|    Robert|       Tan| 38|Developer|
|     Scott|      Cook| 45|Architect|
|       Jen|     Smith| 34|  Manager|
|     Jenny|      Khan| 34|  Manager|
|     Kenny| Sebastian| 34|  Manager|
|     Kumar|    Miller| 35|       HR|
|      Jane|       Doe| 30|Developer|
|      Saif|    Wilson| 40|  Manager|
+----------+----------+---+---------+

windowSpec  = Window.partitionBy("job").orderBy(col("age").desc())

df.withColumn("ntile",ntile(100).over(windowSpec)).show()
+----------+----------+---+---------+-----+
|user_fname|user_lname|age|      job|ntile|
+----------+----------+---+---------+-----+
|     Scott|      Cook| 45|Architect|    1|
|     James|     Apple| 42|Architect|    2|
|      Saif|    Wilson| 40|  Manager|    1|
|       Jen|     Smith| 34|  Manager|    2|
|     Jenny|      Khan| 34|  Manager|    3|
|     Kenny| Sebastian| 34|  Manager|    4|
|       Amy|       Bob| 32|  Manager|    5|
|     Kumar|    Miller| 35|       HR|    1|
|    Robert|       Tan| 38|Developer|    1|
|      Jane|       Doe| 30|Developer|    2|
|      Jane|       Doe| 30|Developer|    3|
+----------+----------+---+---------+-----+

df.withColumn("ntile",ntile(4).over(windowSpec)).show()
+----------+----------+---+---------+-----+
|user_fname|user_lname|age|      job|ntile|
+----------+----------+---+---------+-----+
|     Scott|      Cook| 45|Architect|    1|
|     James|     Apple| 42|Architect|    2|
|      Saif|    Wilson| 40|  Manager|    1|
|       Jen|     Smith| 34|  Manager|    1|
|     Jenny|      Khan| 34|  Manager|    2|
|     Kenny| Sebastian| 34|  Manager|    3|
|       Amy|       Bob| 32|  Manager|    4|
|     Kumar|    Miller| 35|       HR|    1|
|    Robert|       Tan| 38|Developer|    1|
|      Jane|       Doe| 30|Developer|    2|
|      Jane|       Doe| 30|Developer|    3|
+----------+----------+---+---------+-----+
ntile() window function returns the relative rank of result rows within a window partition. In the above example we have used 100 or 4 as arguments to ntile hence it returns ranking values (1 ….100) and (1…4)
Look at the manager section to understand the difference:
+----------+----------+---+---------+-----+
|user_fname|user_lname|age|      job|ntile|
+----------+----------+---+---------+-----+
|      Saif|    Wilson| 40|  Manager|    1|
|       Jen|     Smith| 34|  Manager|    2|
|     Jenny|      Khan| 34|  Manager|    3|
|     Kenny| Sebastian| 34|  Manager|    4|
|       Amy|       Bob| 32|  Manager|    5|
+----------+----------+---+---------+-----+

df.withColumn("ntile",ntile(4).over(windowSpec)).show()
+----------+----------+---+---------+-----+
|user_fname|user_lname|age|      job|ntile|
+----------+----------+---+---------+-----+
|      Saif|    Wilson| 40|  Manager|    1|
|       Jen|     Smith| 34|  Manager|    1|
|     Jenny|      Khan| 34|  Manager|    2|
|     Kenny| Sebastian| 34|  Manager|    3|
|       Amy|       Bob| 32|  Manager|    4|
+----------+----------+---+---------+-----+
ntile() is a window function that distributes rows of an ordered partition into a specified number of approximately equal groups
Analytical functions
Example for cume_dist():
from pyspark.sql.functions import cume_dist
data = [("Jane", "Doe", 30,"Developer"), \
     ("Amy", "Bob", 32,"Manager"), \
     ("James", "Apple", 42,"Architect"), \
     ("Robert", "Tan", 38,"Developer"), \
     ("Scott", "Cook", 45,"Architect"), \
     ("Jen", "Smith", 34,"Manager"), \
     ("Jenny", "Khan", 34,"Manager"), \
     ("Kenny", "Sebastian", 34,"Manager"), \
     ("Kumar", "Miller", 35,"HR"), \
     ("Jane", "Doe", 30,"Developer"), \
     ("Saif", "Wilson", 40,"Manager") \
   ]
columns= ["user_fname", "user_lname","age", "job"]
df = spark.createDataFrame(data = data, schema = columns)
df.printSchema()
df.show()

+----------+----------+---+---------+
|user_fname|user_lname|age|      job|
+----------+----------+---+---------+
|      Jane|       Doe| 30|Developer|
|       Amy|       Bob| 32|  Manager|
|     James|     Apple| 42|Architect|
|    Robert|       Tan| 38|Developer|
|     Scott|      Cook| 45|Architect|
|       Jen|     Smith| 34|  Manager|
|     Jenny|      Khan| 34|  Manager|
|     Kenny| Sebastian| 34|  Manager|
|     Kumar|    Miller| 35|       HR|
|      Jane|       Doe| 30|Developer|
|      Saif|    Wilson| 40|  Manager|
+----------+----------+---+---------+

windowSpec  = Window.partitionBy("job").orderBy(col("age").desc())

df.withColumn("cume_dist",cume_dist().over(windowSpec)).show()
+----------+----------+---+---------+------------------+
|user_fname|user_lname|age|      job|         cume_dist|
+----------+----------+---+---------+------------------+
|     Scott|      Cook| 45|Architect|               0.5|
|     James|     Apple| 42|Architect|               1.0|
|      Saif|    Wilson| 40|  Manager|               0.2|
|       Jen|     Smith| 34|  Manager|               0.8|
|     Jenny|      Khan| 34|  Manager|               0.8|
|     Kenny| Sebastian| 34|  Manager|               0.8|
|       Amy|       Bob| 32|  Manager|               1.0|
|     Kumar|    Miller| 35|       HR|               1.0|
|    Robert|       Tan| 38|Developer|0.3333333333333333|
|      Jane|       Doe| 30|Developer|               1.0|
|      Jane|       Doe| 30|Developer|               1.0|
+----------+----------+---+---------+------------------
cume_dist()is a window function that is to get cumulative distribution of values within a window. It is similar to dense_rank function that is used in SQL
Aggregate functions
data = [("Jane", "Doe", 30,"Developer"), \
     ("Amy", "Bob", 32,"Manager"), \
     ("James", "Apple", 42,"Architect"), \
     ("Robert", "Tan", 38,"Developer"), \
     ("Scott", "Cook", 45,"Architect"), \
     ("Jen", "Smith", 34,"Manager"), \
     ("Jenny", "Khan", 34,"Manager"), \
     ("Kenny", "Sebastian", 34,"Manager"), \
     ("Kumar", "Miller", 35,"HR"), \
     ("Jane", "Doe", 30,"Developer"), \
     ("Saif", "Wilson", 40,"Manager") \
   ]
columns= ["user_fname", "user_lname","age", "job"]
df = spark.createDataFrame(data = data, schema = columns)
df.printSchema()
df.show()

windowSpec  = Window.partitionBy("job").orderBy(col("age").desc())
window_spec_aggregate  = Window.partitionBy("job")

df.withColumn("row",row_number().over(windowSpec)) \
  .withColumn("avg", avg(col("age")).over(window_spec_aggregate)) \
  .withColumn("sum", sum(col("age")).over(window_spec_aggregate)) \
  .withColumn("min", min(col("age")).over(window_spec_aggregate)) \
  .withColumn("max", max(col("age")).over(window_spec_aggregate)) \
  .where(col("row")==1).select("job","avg","sum","min","max") \
  .show()
+---------+------------------+---+---+---+
|      job|               avg|sum|min|max|
+---------+------------------+---+---+---+
|Architect|              43.5| 87| 42| 45|
|  Manager|              34.8|174| 32| 40|
|       HR|              35.0| 35| 35| 35|
|Developer|32.666666666666664| 98| 30| 38|
+---------+------------------+---+---+---+

# This gives the average, sum, min and max of the ages per job
Aggregates
data = [("Jane", "Doe", 30,"Developer"), \
     ("Amy", "Bob", 32,"Manager"), \
     ("James", "Apple", 42,"Architect"), \
     ("Robert", "Tan", 38,"Developer"), \
     ("Scott", "Cook", 45,"Architect"), \
     ("Jen", "Smith", 34,"Manager"), \
     ("Jenny", "Khan", 34,"Manager"), \
     ("Kenny", "Sebastian", 34,"Manager"), \
     ("Kumar", "Miller", 35,"HR"), \
     ("Jane", "Doe", 30,"Developer"), \
     ("Saif", "Wilson", 40,"Manager") \
   ]
columns= ["user_fname", "user_lname","age", "job"]
df = spark.createDataFrame(data = data, schema = columns)
df.printSchema()
df.show()

+----------+----------+---+---------+
|user_fname|user_lname|age|      job|
+----------+----------+---+---------+
|      Jane|       Doe| 30|Developer|
|       Amy|       Bob| 32|  Manager|
|     James|     Apple| 42|Architect|
|    Robert|       Tan| 38|Developer|
|     Scott|      Cook| 45|Architect|
|       Jen|     Smith| 34|  Manager|
|     Jenny|      Khan| 34|  Manager|
|     Kenny| Sebastian| 34|  Manager|
|     Kumar|    Miller| 35|       HR|
|      Jane|       Doe| 30|Developer|
|      Saif|    Wilson| 40|  Manager|
+----------+----------+---+---------+


######################### approx_count_distinct() #########################
from pyspark.sql.functions import approx_count_distinct;
df.select(approx_count_distinct("age")).show()
+--------------------------+
|approx_count_distinct(age)|
+--------------------------+
|                         8|
+--------------------------+
#############################  collect_list() #############################
from pyspark.sql.functions import collect_list;

df.select(collect_list("job")).show(10,False)
+--------------------------------------------------------------------------------------------------------+
|collect_list(job)                                                                                       |
+--------------------------------------------------------------------------------------------------------+
|[Developer, Manager, Architect, Developer, Architect, Manager, Manager, Manager, HR, Developer, Manager]|
+--------------------------------------------------------------------------------------------------------+
#############################  collect_set() #############################
from pyspark.sql.functions import collect_set
df.select(collect_set("job")).distinct().show(10,False)
+-----------------------------------+
|collect_set(job)                   |
+-----------------------------------+
|[Developer, HR, Architect, Manager]|
+-----------------------------------+
#############################  countDistinct() #############################
from pyspark.sql.functions import countDistinct
df.select(countDistinct("job")).show()
+-------------------+
|count(DISTINCT job)|
+-------------------+
|                  4|
+-------------------+
#############################  count #############################
from pyspark.sql.functions import count
df.select(count("job")).show()
+----------+
|count(job)|
+----------+
|        11|
+----------+
Joins & Unions
Join and Unions are different in the way that the data is joined. Unions are used to when you are combining two data-frames of the same structure/schema. Joins are used when you want to combine two data-frames that have different structure and the result contains the columns/features from both of the dataframes.
To put it plainly, UNION results in new rows and JOIN results in new columns(and new rows depending on the joining key).

Example on how to use union():
student_data = [
     ("1","Jane", "Doe", "Student","9","Class IV"), \
     ("2","Amy", "Bob", "Student","9","Class IV"), \
     ("3","James", "Apple","Student","10","Class V"), \
     ("4","Kenny", "Seb", "Student","15","Class X") \
   ]
student_columns= ["#", "fname","lname", "job","age","class"]
student = spark.createDataFrame(data = student_data, schema = student_columns)
student.printSchema()
student.show()
+---+-----+-----+-------+---+--------+
|  #|fname|lname|    job|age|   class|
+---+-----+-----+-------+---+--------+
|  1| Jane|  Doe|Student|  9|Class IV|
|  2|  Amy|  Bob|Student|  9|Class IV|
|  3|James|Apple|Student| 10| Class V|
|  4|Kenny|  Seb|Student| 15| Class X|
+---+-----+-----+-------+---+--------+


teacher_data = [
     ("1","Jhanvi", "Kapoor", "Teacher","32","Class IV"), \
     ("2","Shanaya", "Kumar", "Teacher","30","Class IV"), \
     ("3","Alia", "Bhatt","Teacher","34","Class V"), \
     ("4","Suhana", "Khan", "Teacher","36","Class X") \
   ]
teacher_columns= ["#", "fname","lname", "job","age","class"]
teacher = spark.createDataFrame(data = teacher_data, schema = teacher_columns)
teacher.printSchema()
teacher.show()
+---+-------+------+-------+---+--------+
|  #|  fname| lname|    job|age|   class|
+---+-------+------+-------+---+--------+
|  1| Jhanvi|Kapoor|Teacher| 32|Class IV|
|  2|Shanaya| Kumar|Teacher| 30|Class IV|
|  3|   Alia| Bhatt|Teacher| 34| Class V|
|  4| Suhana|  Khan|Teacher| 36| Class X|
+---+-------+------+-------+---+--------+


student.printSchema()
root
 |-- #: string (nullable = true)
 |-- fname: string (nullable = true)
 |-- lname: string (nullable = true)
 |-- job: string (nullable = true)
 |-- age: string (nullable = true)
 |-- class: string (nullable = true)

teacher.printSchema()
root
 |-- #: string (nullable = true)
 |-- fname: string (nullable = true)
 |-- lname: string (nullable = true)
 |-- job: string (nullable = true)
 |-- age: string (nullable = true)
 |-- class: string (nullable = true)

student.union(teacher).printSchema()
root
 |-- #: string (nullable = true)
 |-- fname: string (nullable = true)
 |-- lname: string (nullable = true)
 |-- job: string (nullable = true)
 |-- age: string (nullable = true)
 |-- class: string (nullable = true)

student.union(teacher).show()
+---+-------+------+-------+---+--------+
|  #|  fname| lname|    job|age|   class|
+---+-------+------+-------+---+--------+
|  1|   Jane|   Doe|Student|  9|Class IV|
|  2|    Amy|   Bob|Student|  9|Class IV|
|  3|  James| Apple|Student| 10| Class V|
|  4|  Kenny|   Seb|Student| 15| Class X|
|  1| Jhanvi|Kapoor|Teacher| 32|Class IV|
|  2|Shanaya| Kumar|Teacher| 30|Class IV|
|  3|   Alia| Bhatt|Teacher| 34| Class V|
|  4| Suhana|  Khan|Teacher| 36| Class X|
+---+-------+------+-------+---+--------+
Joins:
The syntax for a join is:
dataframe1.join(dataframe2, ON, HOW)
ON: This is a condition using the column names from both the data-frames
HOW: This is how we want to join the dataThe HOW can be one of the following:
right,left,right_outer,left_outer,full,full_outer,inner,cross,outer,left_semi, andleft_anti
right/right_outer— This join returns all the rows from the right dataframe regardless of the match. In cases where the key condition doesnt match, it assigns null for those records
left/left_outer—This is opposite of right_outer. This join returns all the rows from the left dataframe regardless of the match. In cases where the key condition doesnt match, it assigns null for those records
inner— This is the default join and probably the most commonly used. This joins two datasets on the given key. In cases where the key don’t match, the rows get dropped from both dataframes. Essentially this is like getting only the common rows
outer/full_outer/full— This join returns all the rows from both dataframes. In cases where the key condition doesnt meet, it returns null for those respective columns
left_semi— This join is very similar to the inner join. The only difference is that leftsemi returns all the columns from the left dataframe and ignores all columns from the right dataframe. Basically it returns columns from the left that have a match to the key condition and the ones that did not match are ignored from both dataframes
left_anti— This is the exact opposite of left_semi. This join will return all the columns from the left dataframe that did not satisfy the key condition
Example on how to use join():
student_data = [
     ("1","Jane", "Doe", "Student","9","Class IV"), \
     ("2","Amy", "Bob", "Student","9","Class IV"), \
     ("3","James", "Apple","Student","10","Class V"), \
     ("4","Kenny", "Seb", "Student","15","Class X") \
   ]
student_columns= ["#", "student_fname","student_lname", "student_job","student_age","student_class"]
student = spark.createDataFrame(data = student_data, schema = student_columns)
student.printSchema()
student.show()
+---+-------------+-------------+-----------+-----------+-------------+
|  #|student_fname|student_lname|student_job|student_age|student_class|
+---+-------------+-------------+-----------+-----------+-------------+
|  1|         Jane|          Doe|    Student|          9|     Class IV|
|  2|          Amy|          Bob|    Student|          9|     Class IV|
|  3|        James|        Apple|    Student|         10|      Class V|
|  4|        Kenny|          Seb|    Student|         15|      Class X|
+---+-------------+-------------+-----------+-----------+-------------+

teacher_data = [
     ("1","Jhanvi", "Kapoor", "Teacher","32","Class IV"), \
     ("2","Shanaya", "Kumar", "Teacher","30","Class IV"), \
     ("3","Alia", "Bhatt","Teacher","34","Class V"), \
     ("4","Suhana", "Khan", "Teacher","36","Class X") \
   ]
teacher_columns= ["#", "teacher_fname","teacher_lname", "teacher_job","teacher_age","teacher_class"]
teacher = spark.createDataFrame(data = teacher_data, schema = teacher_columns)
teacher.printSchema()
teacher.show()
+---+-------------+-------------+-----------+-----------+-------------+
|  #|teacher_fname|teacher_lname|teacher_job|teacher_age|teacher_class|
+---+-------------+-------------+-----------+-----------+-------------+
|  1|       Jhanvi|       Kapoor|    Teacher|         32|     Class IV|
|  2|      Shanaya|        Kumar|    Teacher|         30|     Class IV|
|  3|         Alia|        Bhatt|    Teacher|         34|      Class V|
|  4|       Suhana|         Khan|    Teacher|         36|      Class X|
+---+-------------+-------------+-----------+-----------+-------------+


student.printSchema()
root
 |-- #: string (nullable = true)
 |-- student_fname: string (nullable = true)
 |-- student_lname: string (nullable = true)
 |-- student_job: string (nullable = true)
 |-- student_age: string (nullable = true)
 |-- student_class: string (nullable = true)

teacher.printSchema()
root
 |-- #: string (nullable = true)
 |-- teacher_fname: string (nullable = true)
 |-- teacher_lname: string (nullable = true)
 |-- teacher_job: string (nullable = true)
 |-- teacher_age: string (nullable = true)
 |-- teacher_class: string (nullable = true)


student.join(teacher,student.student_class == teacher.teacher_class,"leftouter").printSchema()
root
 |-- #: string (nullable = true)
 |-- student_fname: string (nullable = true)
 |-- student_lname: string (nullable = true)
 |-- student_job: string (nullable = true)
 |-- student_age: string (nullable = true)
 |-- student_class: string (nullable = true)
 |-- #: string (nullable = true)
 |-- teacher_fname: string (nullable = true)
 |-- teacher_lname: string (nullable = true)
 |-- teacher_job: string (nullable = true)
 |-- teacher_age: string (nullable = true)
 |-- teacher_class: string (nullable = true)


## Here we are joining student dataframe and the teacher dataframe
## to get the names of all the students along with who their teacher is
student.join(teacher,student.student_class == teacher.teacher_class,"leftouter").select("student_fname","student_lname","student_class",concat_ws(" ","teacher_fname","teacher_lname").alias("teacher_name")).show()
+-------------+-------------+-------------+-------------+
|student_fname|student_lname|student_class| teacher_name|
+-------------+-------------+-------------+-------------+
|         Jane|          Doe|     Class IV|Shanaya Kumar|
|         Jane|          Doe|     Class IV|Jhanvi Kapoor|
|          Amy|          Bob|     Class IV|Shanaya Kumar|
|          Amy|          Bob|     Class IV|Jhanvi Kapoor|
|        Kenny|          Seb|      Class X|  Suhana Khan|
|        James|        Apple|      Class V|   Alia Bhatt|
+-------------+-------------+-------------+-------------+
Using a UDF
A User Defined Function is a function written by a user to perform any transformations for a given data-frame. Usually, it is used when a pre-existing transformation function for such a feature does not already exist. For ex, if you want to do some aggregates or concatenations, such functions already exist.
Now let’s say, you want want to convert the student_class which has values like Class IV, Class X, Class V to Grade 4, Grade 10, Grade 5
The first step in a UDF is to create a simple python function that does the functionality you need:
def roman_to_number(string_to_convert):
     if string_to_convert == "Class IV":
          return "Grade 4"
     elif string_to_convert == "Class V":
          return "Grade 5"
     elif string_to_convert == "Class X":
          return "Grade 10"
     return ""
Now we will convert the above function into a UDF that we can use
from pyspark.sql.functions import col, udf
from pyspark.sql.types import StringType
roman_to_number_udf = udf(lambda z: roman_to_number(z))
Now we will use the student data-frame from before :
student_data = [
     ("1","Jane", "Doe", "Student","9","Class IV"), \
     ("2","Amy", "Bob", "Student","9","Class IV"), \
     ("3","James", "Apple","Student","10","Class V"), \
     ("4","Kenny", "Seb", "Student","15","Class X") \
   ]
student_columns= ["#", "student_fname","student_lname", "student_job","student_age","student_class"]
student = spark.createDataFrame(data = student_data, schema = student_columns)
student.printSchema()
student.show()
Let’s apply the UDF now :
student.select("#","student_fname","student_lname","student_age","student_class",roman_to_number_udf(col("student_class")).alias("student_class_in_roman")).show(10,False)
+---+-------------+-------------+-----------+-------------+----------------------+
|#  |student_fname|student_lname|student_age|student_class|student_class_in_roman|
+---+-------------+-------------+-----------+-------------+----------------------+
|1  |Jane         |Doe          |9          |Class IV     |Grade 4               |
|2  |Amy          |Bob          |9          |Class IV     |Grade 4               |
|3  |James        |Apple        |10         |Class V      |Grade 5               |
|4  |Kenny        |Seb          |15         |Class X      |Grade 10              |
+---+-------------+-------------+-----------+-------------+----------------------+
It is extremely important to know the types of values of the column that will be used in the UDF. By this, I mean handling of cases when we have None. In the above example, there won’t be any issue if any of the students had None as the class since that will be caught in the else section, but let’s say that the same function has been defined like this:
from pyspark.sql.functions import col, udf
from pyspark.sql.types import StringType


def roman_to_number(string_to_convert):
    ## NOTE: We are splitting the string here
    class_number = string_to_convert.split(" ")[1]
    if class_number == "IV":
        return "Grade 4"
    elif class_number == "V":
        return "Grade 5"
    elif class_number == "X":
        return "Grade 10"
    return ""

roman_to_number_udf = udf(lambda z: roman_to_number(z))

student_data = [
      ("1","Jane", "Doe", "Student","9","Class IV"), \
      ("2","Amy", "Bob", "Student","9","Class IV"), \
      ("3","James", "Apple","Student","10","Class V"), \
      ("4","Kenny", "Seb", "Student","15",None) \
    ]

student_columns= ["#", "student_fname","student_lname", "student_job","student_age","student_class"]
student = spark.createDataFrame(data = student_data, schema = student_columns)
student.printSchema()
root
 |-- #: string (nullable = true)
 |-- student_fname: string (nullable = true)
 |-- student_lname: string (nullable = true)
 |-- student_job: string (nullable = true)
 |-- student_age: string (nullable = true)
 |-- student_class: string (nullable = true)

student.show()
+---+-------------+-------------+-----------+-----------+-------------+
|  #|student_fname|student_lname|student_job|student_age|student_class|
+---+-------------+-------------+-----------+-----------+-------------+
|  1|         Jane|          Doe|    Student|          9|     Class IV|
|  2|          Amy|          Bob|    Student|          9|     Class IV|
|  3|        James|        Apple|    Student|         10|      Class V|
|  4|        Kenny|          Seb|    Student|         15|         null|
+---+-------------+-------------+-----------+-----------+-------------+

## NOTE: Here the student Kenny, has the student_class as null.
## So now when we use the UDF, we will see an error
student.select("#","student_fname","student_lname","student_age","student_class",roman_to_number_udf(col("student_class")).alias("student_class_in_roman")).show(10,False)
ERROR:
AttributeError: ‘NoneType’ object has no attribute ‘split’
This is because of the split() we have used in our UDF. A quick fix for this is:
from pyspark.sql.functions import col, udf
from pyspark.sql.types import StringType

def roman_to_number(string_to_convert):
    if string_to_convert:
      ## NOTE: We are splitting the string here
      class_number = string_to_convert.split(" ")[1]
      if class_number == "IV":
          return "Grade 4"
      elif class_number == "V":
          return "Grade 5"
      elif class_number == "X":
          return "Grade 10"
      return ""
    else:
      return ""

roman_to_number_udf = udf(lambda z: roman_to_number(z))

student.select("#","student_fname","student_lname","student_age","student_class",roman_to_number_udf(col("student_class")).alias("student_class_in_roman")).show(10,False)
+---+-------------+-------------+-----------+-------------+----------------------+
|#  |student_fname|student_lname|student_age|student_class|student_class_in_roman|
+---+-------------+-------------+-----------+-------------+----------------------+
|1  |Jane         |Doe          |9          |Class IV     |Grade 4               |
|2  |Amy          |Bob          |9          |Class IV     |Grade 4               |
|3  |James        |Apple        |10         |Class V      |Grade 5               |
|4  |Kenny        |Seb          |15         |null         |                      |
+---+-------------+-------------+-----------+-------------+----------------------+

## NOTE: AS you can see, null has been handled and
## student_class_in_roman is now ""
RDD map
- map() function is used to apply transformations on one or all elements of the RDD. Usually we use it when we want to add a new column, update a column or transform the data. The size of the RDD before applying the map function and after, will be the same (imagine passing each row to the map function and the map function returns a new one back. The number of rows will remain the same, but the number of columns and the schema can change)
- map() function is always applied on an RDD and not on a data-frame
- map() function returns a new RDD
from pyspark import Row
data = [("Jane", "Doe", 30,"Developer"), \
     ("Amy", "Bob", 32,"Manager"), \
     ("James", "Apple", 42,"Architect"), \
     ("Robert", "Tan", 38,"Developer"), \
     ("Scott", "Cook", 45,"Architect"), \
     ("Jen", "Smith", 34,"Manager"), \
     ("Jenny", "Khan", 34,"Manager"), \
     ("Kenny", "Sebastian", 34,"Manager"), \
     ("Kumar", "Miller", 35,"HR"), \
     ("Jane", "Doe", 30,"Developer"), \
     ("Saif", "Wilson", 40,"Manager") \
   ]
columns= ["user_fname", "user_lname","age", "job"]
df = spark.createDataFrame(data = data, schema = columns)
df.printSchema()
df.show()

+----------+----------+---+---------+
|user_fname|user_lname|age|      job|
+----------+----------+---+---------+
|      Jane|       Doe| 30|Developer|
|       Amy|       Bob| 32|  Manager|
|     James|     Apple| 42|Architect|
|    Robert|       Tan| 38|Developer|
|     Scott|      Cook| 45|Architect|
|       Jen|     Smith| 34|  Manager|
|     Jenny|      Khan| 34|  Manager|
|     Kenny| Sebastian| 34|  Manager|
|     Kumar|    Miller| 35|       HR|
|      Jane|       Doe| 30|Developer|
|      Saif|    Wilson| 40|  Manager|
+----------+----------+---+---------+

## Let us say we want to perform three functions:
## 1. Add a new column where if the person is
##    Manager/HR  the column will indicate "MANAGEMENT" and if not
##    "Individual Contributor"
## 2. Modify an existing column(age) where the age will now be in
##    words(not numeric)
## 3. Will combine the results of the "user_fname" and "user_lname"
##    to "user_name"


def all_sorts_of_transformations(row):
     num2words = {30: 'Thirty', 32: 'Thirty Two', 42: 'Forty Two', 38: 'Thirty Eight', 45: 'Forty Five', 34: 'Thirty Four', 35: 'Thirty Five', 40: 'Forty'}
     row_dict = row.asDict()
     new_row_dict = row.asDict()
     ## Performing #3
     new_row_dict["user_name"] = row_dict["user_fname"] + " " + row_dict["user_lname"]
     ## Performing #2
     new_row_dict["age"] = num2words[row_dict["age"]]
     ## Performing #1
     new_row_dict["job"] = row_dict["job"]
     new_row_dict["job_classification"] = "MANAGEMENT" if row_dict["job"] in ["HR","MANAGER"] else "INDIVIDIAL CONTRIBUTOR"
     return Row(**new_row_dict)

df.printSchema()
root
 |-- user_fname: string (nullable = true)
 |-- user_lname: string (nullable = true)
 |-- age: long (nullable = true)
 |-- job: string (nullable = true)
## NOTE :
## 1. There are 4 columns
## 2. Column `age` is of type long


## Now let us apply `all_sorts_of_transformations` on df
df_new = df.rdd.map(all_sorts_of_transformations).toDF()

df_new.printSchema()
root
 |-- age: string (nullable = true)
 |-- job: string (nullable = true)
 |-- job_classification: string (nullable = true)
 |-- user_fname: string (nullable = true)
 |-- user_lname: string (nullable = true)
 |-- user_name: string (nullable = true)
## NOTE :
## 1. There are now 6 columns
## 2. Column `age` is of type string

df_new.show(100,False)
+------------+---------+----------------------+----------+----------+---------------+
|age         |job      |job_classification    |user_fname|user_lname|user_name      |
+------------+---------+----------------------+----------+----------+---------------+
|Thirty      |Developer|INDIVIDIAL CONTRIBUTOR|Jane      |Doe       |Jane Doe       |
|Thirty Two  |Manager  |INDIVIDIAL CONTRIBUTOR|Amy       |Bob       |Amy Bob        |
|Forty Two   |Architect|INDIVIDIAL CONTRIBUTOR|James     |Apple     |James Apple    |
|Thirty Eight|Developer|INDIVIDIAL CONTRIBUTOR|Robert    |Tan       |Robert Tan     |
|Forty Five  |Architect|INDIVIDIAL CONTRIBUTOR|Scott     |Cook      |Scott Cook     |
|Thirty Four |Manager  |INDIVIDIAL CONTRIBUTOR|Jen       |Smith     |Jen Smith      |
|Thirty Four |Manager  |INDIVIDIAL CONTRIBUTOR|Jenny     |Khan      |Jenny Khan     |
|Thirty Four |Manager  |INDIVIDIAL CONTRIBUTOR|Kenny     |Sebastian |Kenny Sebastian|
|Thirty Five |HR       |MANAGEMENT            |Kumar     |Miller    |Kumar Miller   |
|Thirty      |Developer|INDIVIDIAL CONTRIBUTOR|Jane      |Doe       |Jane Doe       |
|Forty       |Manager  |INDIVIDIAL CONTRIBUTOR|Saif      |Wilson    |Saif Wilson    |
+------------+---------+----------------------+----------+----------+---------------+


## OBSERVATIONS
## 1. New column `job_classification` ✅
## 2. Column `age` is now string ✅
## 3. New column `user_name` with values from `user_fname` & `user_lname` ✅
## 4. The count of rows before and after is the same.✅
Common error while using map():
I encountered an issue once when I was reading from a CSV a file. Let’s say one of the columns in the CSV file contained an Array. More often than not, no-one is going to enforce dataType restriction on column in a CSV(duh!) and that’s when we might encounter a problemAlso note the syntax here:
df.rdd.map(all_sorts_of_transformations).toDF().show(100,False)
from pyspark import Row
## IF you cant' read from a CSV, you can use this code below:
student_data = [
("1","Kenny Sebastian","Class IV",["Spanish","History","Geography","Economics"]), \
("2","James Apple","Class IV",None), \
("3","Amy Bob","Class V",["Mathematics","Science"]), \
("4","Jane Doe","Class V",["English"]), \
("5","Jenny Christian","Class X",None)]
student_columns= ["roll_number", "student_name","student_class", "subject_with_distinction"]
student = spark.createDataFrame(data = student_data, schema = student_columns)
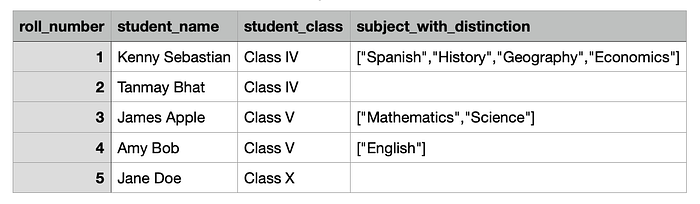
student.show(10,False)
+-----------+---------------+-------------+----------------------------------------+
|roll_number|student_name |student_class|subject_with_distinction |
+-----------+---------------+-------------+----------------------------------------+
|1 |Kenny Sebastian|Class IV |[Spanish, History, Geography, Economics]|
|2 |James Apple |Class IV |null |
|3 |Amy Bob |Class V |[Mathematics, Science] |
|4 |Jane Doe |Class V |[English] |
|5 |Jenny Christian|Class X |null |
+-----------+---------------+-------------+----------------------------------------+
## Let's say you want to count the number of subjects_with_distinction for each student
def count(row):
row_dict = row.asDict()
row_dict["count_of_subjects_with_distinction"] = len(row_dict["subject_with_distinction"])
return Row(**row_dict)
student.rdd.map(count).toDF().show()
ERROR:
------
TypeError: object of type 'NoneType' has no len()
####################################### FIX 1 ################################################################################
def count_fix1(row):
row_dict = row.asDict()
if row_dict["subject_with_distinction"]:
row_dict["count_of_subjects_with_distinction"] = len(row_dict["subject_with_distinction"])
return Row(**row_dict)
student.rdd.map(count_fix1).toDF().show()
ERROR:
------
Traceback (most recent call last):
File "<stdin>", line 1, in <module>
File "/usr/lib/spark/python/pyspark/sql/session.py", line 58, in toDF
return sparkSession.createDataFrame(self, schema, sampleRatio)
File "/usr/lib/spark/python/pyspark/sql/session.py", line 746, in createDataFrame
rdd, schema = self._createFromRDD(data.map(prepare), schema, samplingRatio)
File "/usr/lib/spark/python/pyspark/sql/session.py", line 390, in _createFromRDD
struct = self._inferSchema(rdd, samplingRatio, names=schema)
File "/usr/lib/spark/python/pyspark/sql/session.py", line 363, in _inferSchema
raise ValueError("The first row in RDD is empty, "
ValueError: The first row in RDD is empty, can not infer schema
########################################## FIX 2 ##################################################################################
def count_fix2(row):
row_dict = row.asDict()
if row_dict["subject_with_distinction"]:
row_dict["count_of_subjects_with_distinction"] = len(row_dict["subject_with_distinction"])
else:
row_dict["count_of_subjects_with_distinction"] = 0
return Row(**row_dict)
student.rdd.map(count_fix2).toDF().show(10,False)
+----------------------------------+-----------+-------------+---------------+----------------------------------------+
|count_of_subjects_with_distinction|roll_number|student_class|student_name |subject_with_distinction |
+----------------------------------+-----------+-------------+---------------+----------------------------------------+
|4 |1 |Class IV |Kenny Sebastian|[Spanish, History, Geography, Economics]|
|0 |2 |Class IV |James Apple |null |
|2 |3 |Class V |Amy Bob |[Mathematics, Science] |
|1 |4 |Class V |Jane Doe |[English] |
|0 |5 |Class X |Jenny Christian|null |
+----------------------------------+-----------+-------------+---------------+----------------------------------------+Common mistake while trying to import an external package
Let me explain with an example. For this example, I’m going to use a library called num2words
Now let’s say we want to convert the numeric value of age into words which is what the library num2words will help us do.
For ex: num2words(35) will result in the output thirty-five
Normally when you do not have a package installed, it is common for us to run:
python3 -m pip install num2wordsOnce you are done, you log into the pyspark console and type:
from num2words import num2words
num2words(35)
'thirty-five'
At this point, since we have num2words installed, let’s try to use it in a map function
from pyspark import Row
data = [("Jane", "Doe", 30,"Developer"), \
     ("Amy", "Bob", 32,"Manager"), \
     ("James", "Apple", 42,"Architect"), \
     ("Robert", "Tan", 38,"Developer"), \
     ("Scott", "Cook", 45,"Architect"), \
     ("Jen", "Smith", 34,"Manager"), \
     ("Jenny", "Khan", 34,"Manager"), \
     ("Kenny", "Sebastian", 34,"Manager"), \
     ("Kumar", "Miller", 35,"HR"), \
     ("Jane", "Doe", 30,"Developer"), \
     ("Saif", "Wilson", 40,"Manager") \
   ]
columns= ["user_fname", "user_lname","age", "job"]
df = spark.createDataFrame(data = data, schema = columns)
df.printSchema()
df.show()
+----------+----------+---+---------+
|user_fname|user_lname|age|      job|
+----------+----------+---+---------+
|      Jane|       Doe| 30|Developer|
|       Amy|       Bob| 32|  Manager|
|     James|     Apple| 42|Architect|
|    Robert|       Tan| 38|Developer|
|     Scott|      Cook| 45|Architect|
|       Jen|     Smith| 34|  Manager|
|     Jenny|      Khan| 34|  Manager|
|     Kenny| Sebastian| 34|  Manager|
|     Kumar|    Miller| 35|       HR|
|      Jane|       Doe| 30|Developer|
|      Saif|    Wilson| 40|  Manager|
+----------+----------+---+---------+
Let us define the map function and call it.
from num2words import num2words
def all_sorts_of_transformations(row):
     row_dict = row.asDict()
     new_row_dict = row.asDict()
     new_row_dict["age"] = num2words(row_dict["age"])
     return Row(**new_row_dict)

df.rdd.map(all_sorts_of_transformations).toDF().show()
This above code ends up with the following error:
######################################## ERROR ###########################################
ModuleNotFoundError: No module named 'num2words'
##########################################################################################
At this point you think, oh may be the import should be within the function definition ¯\_(ツ)_/¯
def all_sorts_of_transformations_fix1(row):
     from num2words import num2words
     row_dict = row.asDict()
     new_row_dict = row.asDict()
     new_row_dict["age"] = num2words(row_dict["age"])
     return Row(**new_row_dict)

df.rdd.map(all_sorts_of_transformations_fix1).toDF().show()
This above code ALSO ends up with the following error:
######################################## ERROR ###########################################
ModuleNotFoundError: No module named 'num2words'
##########################################################################################
REASON:
The real issue here is that the installation has happened only on the driver instance. When we call a map function on a specific pyspark data-frame, this renders every row of the data-frame to the map function — This happens in parallel across the different worker nodes (of the EMR in my case) The module num2words does not exist on those worker nodes and hence we see this failure.
Essentially there are two ways to solve this:
- You can use a
bootstrap.shscript, and provide that as a parameter while launching your EMR cluster. All the packages mentioned in the bootstrap script will be installed on all the nodes of the cluster (driver + worker). - You can also use spark context to install the package. Here is how you can do that:
## 1. Find the spark-defaults.conf and add the following to that file:
spark.pyspark.virtualenv.enabled true
spark.pyspark.virtualenv.bin.path /usr/bin/virtualenv

## Then go to the pyspark console and type this:
sc.install_pypi_package("num2words")
Now try the same example from above and you will see the results:
def all_sorts_of_transformations_fix1(row):
     from num2words import num2words
     row_dict = row.asDict()
     new_row_dict = row.asDict()
     new_row_dict["age"] = num2words(row_dict["age"])
     return Row(**new_row_dict)

df.rdd.map(all_sorts_of_transformations_fix1).toDF().show()
+------------+---------+----------+----------+
|         age|      job|user_fname|user_lname|
+------------+---------+----------+----------+
|      thirty|Developer|      Jane|       Doe|
|  thirty-two|  Manager|       Amy|       Bob|
|   forty-two|Architect|     James|     Apple|
|thirty-eight|Developer|    Robert|       Tan|
|  forty-five|Architect|     Scott|      Cook|
| thirty-four|  Manager|       Jen|     Smith|
| thirty-four|  Manager|     Jenny|      Khan|
| thirty-four|  Manager|     Kenny| Sebastian|
| thirty-five|       HR|     Kumar|    Miller|
|      thirty|Developer|      Jane|       Doe|
|       forty|  Manager|      Saif|    Wilson|
+------------+---------+----------+----------+
Woohoo 💃💃💃💃!
Conclusion
I hope this gives you confidence to go explore bespoke datasets on your own (along with the article as your companion 😉)
I personally find pyspark and the features it offers to be easier and more fun to use than the traditional sql. Let me know what you think in the comments. Ciao, and keep exploring!